

SEARS HOME APPLIANCES
THE OPPORTUNITY
The home appliance team initially approached us to help them develop SEO standards they could share with their manufacturer and brand partners in an effort to improve their product description content.
However, we recognized that there was a greater opportunity to help the business leverage shopping behaviors outside of just SEO to improve their conversion rates, lower product page bounce rates, and the overall shopping experience for Sears.com.
Due to the breadth of the home appliance business and a shopper’s journey, we opted to keep our scope focused on the product description pages (PDPs) themselves, as these pages held the bulk of the business’s opportunities, such as:
Being the only page (at the time) where a shopper was actively choosing to add a product to their cart (purchasing decision / conversion).
SEO value (there were 4-5 separate SEO opportunities on these pages, depending on the appliance type).
Having one of the highest bounce rates in the funnel for the business.
Because the business had plenty of internal data to work with, such as a traffic reports and revenue analysis, we opted to focus our discovery efforts on competitive analysis and building out a home appliance shopper persona and persona types.
Check out some of the excerpts from our research and recommendations below:


KEY OBSERVATIONS
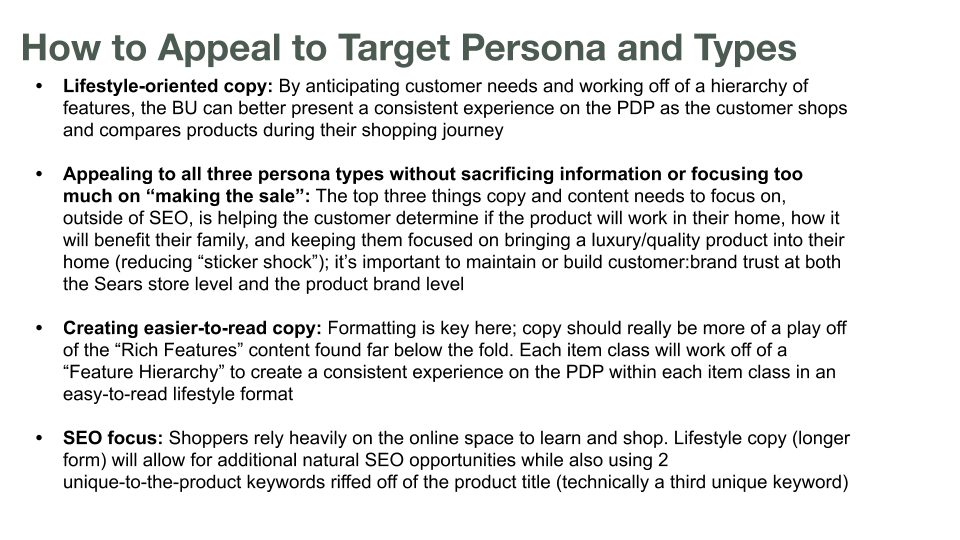
Due to the volume of products, most of our content was copy-pasted from manufacturer brochures, resulting in inconsistent and difficult-to-read product description copy
Key features and attributes of products weren’t being called out, making it difficult for shoppers to do comparison shopping within the Sears experience (this likely contributed to cart abandonment and low conversion rates, as users felt they needed to research their purchase somewhere else before buying)
Compared to our competitors, almost all of our product descriptions lacked any kind of lifestyle or branding to help connect the idea of ease of use, luxury, and personalized home to the consumer.
While the business had revenue peaks throughout the year, these were a result of sales the business was running rather than seasonal shopping behaviors (a unique attribute, as the majority of Sears and Kmart business lines were actually more seasonal-based, rather than evergreen).
The home appliance shopper persona can be broken into three types: Under Duress, Upgrading to Something New, and New Home Owner.
WHAT WE DID
Our short-term approach was to create content standards to help us leverage SEO opportunities both on the page and with external algorithms.
I put together a competitive analysis of what our top competitors were doing on their product pages, looked at what we were and weren’t leveraging on our own product pages, and built out the home appliance shopping persona to help us tailor content-specific recommendations.
Working with the user research team, I was able to leverage our existing base shopper personas and then overlay additional data and insights from our Communities team (where users were asking product-related questions and leaving reviews), home appliance merchants, and shopper interviews to create the home appliance shopper persona and the underlying types.
Using the data we gathered, the competitive analysis, and the personas we created, we then:
Updated the product title formula to make it easier for shoppers to find the product they want and to improve our ranking on external SERPs.
Created feature hierarchies for all major kitchen and laundry appliances to make it easier for shoppers to compare items, scan a product’s description, and see if a product had their preferred features (or not).
Updated our content standards to move away from chunky paragraph descriptions and instead use mini paragraphs to highlight lifestyle attributes (such as time-savers or luxury) and unique or highly sought-after features.
Borrowed marketing CTA best practices to refine lifestyle copy that was geared towards the target shopper personas.
RESULTS
We measured the before and after performance of the top 100 items in each major appliance category after the summer quarter and saw an average 11% lift in conversion, engagement (or, decreased bounce rate), and delta revenue for the business. This later translated to an average 28% lift for the business over the year.
The business continued to leverage the insights and data we gathered and we circled back a year later to reorganize feature components on appliance product pages, leading to an additional 8% lift in conversion during an AB test.
The feature hierarchies were later used to drive an upsell initiative for appliances, leading to an additional 5% lift in revenue during an AB test.
The feature hierarchies were also used to create in-store feature-focused signage.